I’ve promised dancing ibises. Here they are.


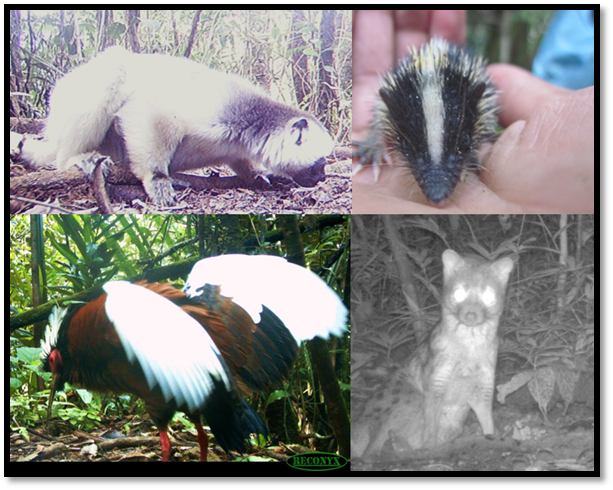
Our cameras aren’t carnivore-specific. They don’t turn off and save battery when a zebu steps (or lays) in front of them (even if it’s for hours at a time!). They take pictures of everything. Because of this, we have collected enough captures of other terrestrial species (ground-dwelling birds and small mammals) to be able to study not only Makira’s carnivores, but a sizeable section of Makira’s other species.
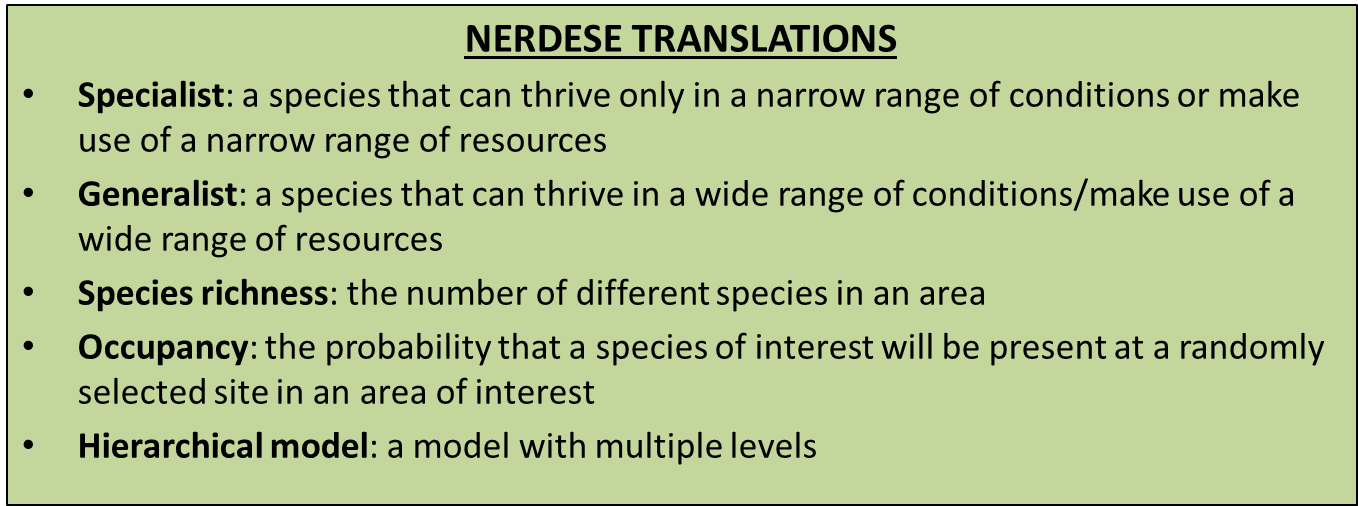
Click to see bolded terms.
The world over, habitat disturbance creates a process in ecological communities where native/specialist species disappear and (potentially) are replaced by exotic/generalist species. Couas are replaced by chickens, fossa by feral cats and tenrecs by black rats. With our dataset, we can examine how species other than the carnivores are affected by habitat degradation/fragmentation, human activity and exotic species.
Objective 2A: The Kitchen Sink
What? For this subobjective, I want to describe each survey’s ecological community by estimating species richness, individual species’ occupancy and detection probability and determining community structure. In the case of estimating abundance (of individual animals or species), the Dramatics were wrong. What you see is definitely not what you get. There will always be that lemur that you miss, or that fossa that sneaks past the camera because he’s not very photogenic, you know? In the past, people would count the number of species that they saw and claim that it was the true species richness of the site. But now we know that we should incorporate detection probability if we want to estimate the true number of species that can be found at the site. Of course, knowing how many species should be there doesn’t help you if you want to know what those species are. But at least you know how many are there.
How? For this entire objective, I get to choose from a smorgasbord of analytical choices. I could use CMR models to estimate species richness, for animals we catch on camera trap and for the lemurs we survey. Remember, how CMR models estimate population abundance? Well, check this, rookie:

All you need to do is upgrade the model: different individuals become different species, and population abundance becomes the abundance of species.
To estimate each species’ occupancy I can use Program Presence or unmarked in R…
OR…I could use hierarchical models to estimate species richness, species’ occupancy and detection probability, all at the same time!!!!
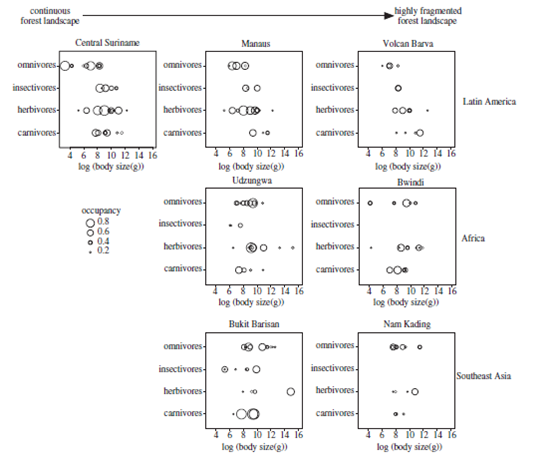
From Ahumada et al. 2011.
Finally, using the results collected from my analyses (specifically, occupancy probability) and natural history information, I will make a handy chart, much like the one you see here, for each survey. This will provide a nice visual representation of how the ecological community looked during each survey.
Why? All of these analyses will describe the ecological community during each of the surveys, in terms of how “present” a species is (occupancy), how many species there should be (species richness) and what the community “looks” like (community structure). Once I have all these little bits of data, I will be able to compare between surveys, and potentially find relationships between how complete a community is and habitat degradation/fragmentation.
Objective 2B:Are Fossa Biodiversity Indicators?
What? The subobjective above has given us the foundation for this subobjective. We know red-breasted coua occupancy probability. So why is red-breasted coua occupancy higher during this survey than that survey? Why are there more species at this site compared to this one? What factors are influencing other species and species richness, and is fossa density one of them?
How? Again, I have a couple of choices to answer the questions above. I could use linear regression to examine the relationships between each species’ occupancy and habitat degradation/fragmentation, exotic species, human activity and fossa density.
OR…I could use hierarchical models (again)! In addition to estimating species richness, species’ occupancy and detection probability (all at the same time), if you throw factors like human activity into the mix, the model will show you how each species is affected by that factor.
It’s like a one-stop shop of analytical results. You wanna know how many species you got? We can do that. You wanna know how they are affected by feral cats? We can do that, too. You want this to be a canned program? Sorry. We can’t do everything. *cue tinny jingle* Hierarchical Models: get your results here!
Why? Just as it is important to understand what influences fossa density, it is important to understand what influences other species, and species richness. Using the results from this section, I will be able to suggest conservation actions to keep Makira part of a biodiversity hotspot within a biodiversity hotspot.
Objective 2C: Times, They Are A-Changin’
What? How are species doing over time at the sites we’ve resurveyed (Anjanaharibe and Mangabe)? Is species richness staying constant or is it changing? What about the community structure? As the years go by, are there more gaps in the community?
How? No hierarchical models here, unless they come up with one that can use multiple seasons of data (they probably will). In this case, I will use a robust design CMR model. Robust design models are able to take multiple years of data and estimate things like the percentage of species that persist over the years and the rate of change in species richness.
Why? Personal anecdote time! I say personal anecdote because the results are preliminary, but it seems like there have been fewer and fewer captures at AJB as each year goes by. If you look at the data from the first survey, coua strutted in front of the camera constantly. The forest floor was seething (seething!) with red forest rats.
However, in recent years, the forest floor no longer seethes. It occasionally twitches, but there seem to be fewer red forest rats. Couas still strut, but they aren’t on parade. The site which is the crown jewel of this study seems to be losing its species. I want to confirm this, and, hopefully, help to change this decline.
You’ve made it to the end! I can’t give you a free life, but I can say congrats! I hope you enjoyed this tour through the madness that will be my Master’s thesis. Now you know why feral cats are such a problem, where the study sites are, what detection probability means (hopefully) and how we’re using data that we didn’t mean to collect to help Makira’s greater ecological communities!
Check out our Sponsors page to see who is supporting us and the Gallery page for pictures from past and present field seasons.
If your kids have done something terrible and you are looking for a way to punish them, click here!
And keep checking back for new posts on analysis topics, graduate school, grant writing and travels.
